Today we are shedding some light on the #SAPIBP functionalities introduced with the #2302 release 💡
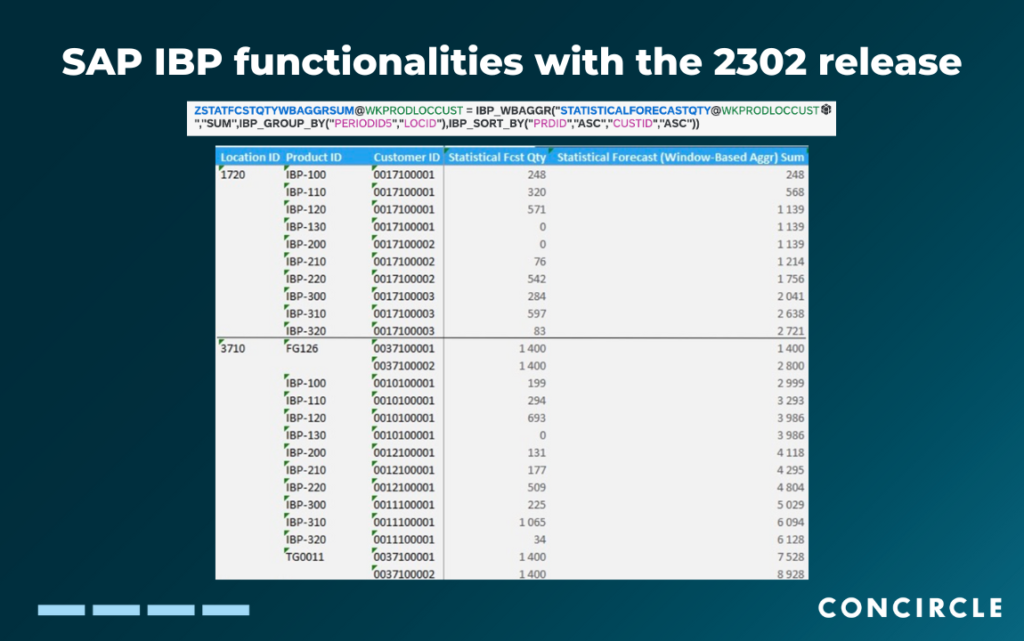
In today’s post, we’ll talk about window-based aggregation. This feature allows the cumulative aggregation of data 💻 It is implemented as a key figure calculation, like the example seen below. The result of the key figure calculation is the window-based aggregation of the forecast quantities.
Two “windows” have been created, one for each location ✅ In each window, the entries have been sorted according to product ID and customer ID. The cumulated values of the forecasts can be seen in the right column of the second screenshot below ⬇️
The window-based aggregation offers much more flexibility and control to planners when it comes to cumulative aggregation, as the attributes used for creating the windows and sorting the data can be chosen in a key figure calculation. Furthermore, different options for cumulative aggregation, like summing up the values or taking their average, are supported ✅